Pivot Query Generator for SQL Server 2005
SQL Server 2005 has a new feature called the PIVOT operator. It's useful in generating cross tab reports. Well, let me start by giving an example.
Lets say we have a table called the distance_tbl that gives the distance between any two cities.
create table distance_tbl
(city1 char(1),
city2 char(1),
distance int
)
Let me insert some values into the table.
insert into distance_tbl values('A','B',1012)
insert into distance_tbl values('A','C',103)
insert into distance_tbl values('A','D',232)
insert into distance_tbl values('A','E',123)
insert into distance_tbl values('B','C',504)
insert into distance_tbl values('B','D',432)
insert into distance_tbl values('B','E',987)
insert into distance_tbl values('C','D',56)
insert into distance_tbl values('C','E',551)
insert into distance_tbl values('D','E',687)
Now take the first row that was inserted. It says that the distance between cities A and B is 1012 miles.
Now if I want to generate a chart (that is much more readable) out of the data on the table. Say something like this:
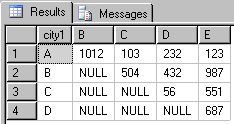
The above table is pretty self-explainatory. Choose a city in a row and in a column the point where the row and column intersect will give the distance between the two cities.
I can get the result in 2005 using this query:
select * from distance_tbl
pivot (sum(distance) for city2 in (B,C,D,E)) as P
Now, the feature is cool. But the only problem is that you will have to type all the possible values inside the IN clause, meaning it has to be constants.
It would have been great if we had something like this:
select * from distance_tbl
pivot (sum(distance) for city2 in (select distinct city2 from distance_tbl)) as P
Anyways for the data I had, if I needed to generate the chart, it was simple. Assuming we have close to a 100 cities... I wouldn't want to type that query :)
Well, I have created a primitive stored procedure that can generate the PIVOT query, taking into account all the values in the pivot column. Feel free to change the proc and use it. Also, let me know if you have any suggestion for customization, I would be happy to incorporate it.
/* updated the proc on Nov 20, 2006 to allow filtering of the pivot columns and to choose the non-pivotal columns
*/
create proc GeneratePivotQuery (
@TableName varchar(100), -- Table to select from
@AggregateFunction varchar(10), -- Aggregate to be done on the value column
@ValueColumn varchar(100),
@PivotColumn varchar(100), -- Column for which the values needs to be transposed
@FilterCondition varchar(1000), -- Filtering to be done on choosing the pivot values
@OtherColumns varchar(1000)) -- Columns selected other than the pivot columns
as
begin
declare @List varchar(MAX)
declare @ConcatQuery nvarchar(MAX)
set @ConcatQuery = 'select @ListOut = stuff((select distinct '',' +
char(10) + char(9) + '['' + '+ @PivotColumn +
' + '']'' from ' + @TableName +
isnull(' where ' + @FilterCondition,'') +
' for xml path('''')),1,1,'''')'
exec sp_executesql
@ConcatQuery,
N'@ListOut varchar(MAX) output',
@ListOut = @List OUTPUT
/* this will print the query used to generate the pivoted result */
print 'select '+ char(10) + char(9) + @OtherColumns + ','
+ @List + char(10) + ' from ' + @TableName + char(13) +
' pivot (' + char(10) + replicate(char(9),2) +
@AggregateFunction + '(' + @ValueColumn +
') for ' + @PivotColumn + ' in (' +
replace(replace(@List,char(9),''),char(10),'') + ')' +
char(13)+ char(9) + char(9) + ') as P' + replicate(char(10),5)
/* this will generate the result set */
exec('select '+ @OtherColumns + ',' + @List + ' from ' + @TableName +
' pivot (' + @AggregateFunction + '(' + @ValueColumn +
') for ' + @PivotColumn + ' in (' + @List + ')) as P')
end
Here is the call to the stored procedure, that will pivot those values in city2 where city2 is between 'B' and 'D' and display the result. You can get the query, used to generate the result, from the messages tab.
DECLARE @TableName varchar(100)
DECLARE @AggregateFunction varchar(10)
DECLARE @ValueColumn varchar(100)
DECLARE @PivotColumn varchar(100)
DECLARE @FilterCondition varchar(1000)
DECLARE @OtherColumns varchar(1000)
set @TableName = 'distance_tbl'
set @AggregateFunction = 'sum'
set @ValueColumn = 'distance'
set @PivotColumn = 'city2'
set @FilterCondition = 'city2 between ''B'' and ''D'''
set @OtherColumns = 'city1'
EXECUTE [dbo].[GeneratePivotQuery]
@TableName
,@AggregateFunction
,@ValueColumn
,@PivotColumn
,@FilterCondition
,@OtherColumns
Here are the results of the above SP:

If, you look at the messages section, you will find the query used.
 You can copy the query and tweak it to your requirements:
If the columns need not be filtered, then pass a null to @FilterCondition and execute the SP.
set @FilterCondition = NULL
Pivot Query Generator for SQL Server 2000 can be found here.


2 comments:
Great article, thanks for this...
Many thanks!
It really helped.
Post a Comment